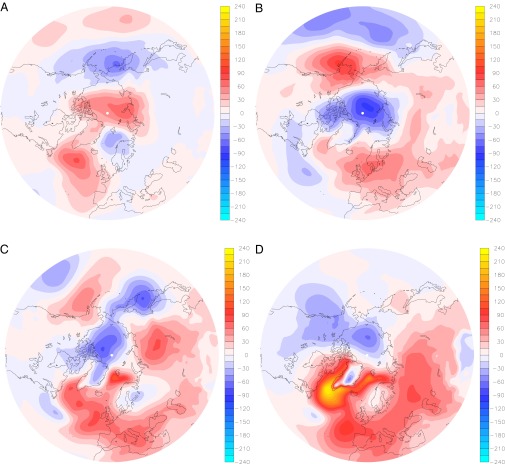
Fig. 3.
Stereographic projection of Northern Hemisphere (between 30° and 90°N) SLP anomalies, relative to the climatology of years 200–400. Units are in pascals. (A) Twenty-year-averaged SLP anomaly for the years 390–410. (B) As in A, but for the years 410–430. A and B show enhanced blocking over the Greenland–Iceland–Norwegian seas, leading to the development of a negative SAT anomaly before the onset of coupled SIC and SLP anomalies near the sea-ice margin. (C) Twenty-year-averaged SLP anomaly for the years 430–450 when coupling to SIC anomalies starts, just before the cold event. (D) As in C, but for the century-averaged SLP anomaly for the years 450–550 during the height of the cold event.

