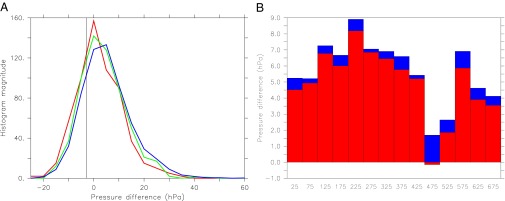
Fig. 5.

Blocking characteristics associated with the cold event. To characterize blocking, a pressure index defined by the difference between 10°E and 40°W at 65°N was chosen. Positive values indicate northward flow, negative values indicate southward flow. Statistics were based on monthly mean output as the length of the integration (1,125 y) precluded saving fields at higher frequencies. (A) Probability density function of the pressure index in histogram magnitude based on 5-hPa bins. The blue curve is for years 200–400, which is taken as the climatology. The red curve is for the first half of the cold event, years 450–500; the green curve is for the second half of the cold event, years 500–550. The black vertical line separates the blocked regime from the normal regime, defined by the mean minus 1σ from the climatology. (B) Bar chart of mean pressure index (red), and means for the normal regime (blue) in hectopascals, for 50-y periods from years 0 to 700 highlighting the negative pressure index anomalies in the years 450–550.
