Fig. 1.
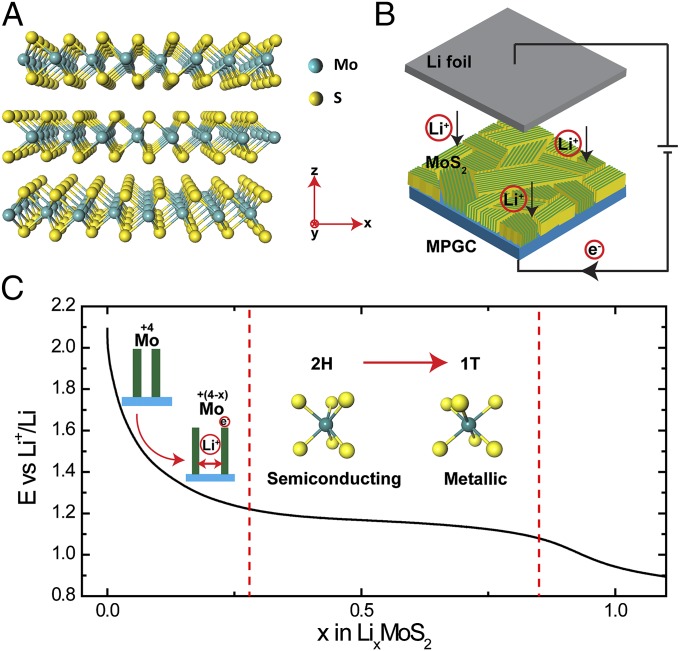
Schematics and galvanostatic discharge curve of Li electrochemical intercalation into MoS2 nanofilms. (A) Crystal structure of 2H MoS2. (B) Schematic of the battery testing system. The cathode is MoS2 nanofilm with molecular layers perpendicular to the substrate, where the green and yellow colors represent the edge sites and the terrace sites, respectively. The anode is the Li foil. (C) Galvanostatic discharge curve representing the lithiation process. Li intercalates into the van der Waals gaps of MoS2 to donate electrons to the slabs and expand the layer spacing. The voltage monotonically drops to 1.2 V vs. Li+/Li to reach a Li content of 0.28, after which the system undergoes a 2H to 1T MoS2 first-order phase transition. The atomic structure is changed from trigonal prismatic to octahedral, along with the electronic semiconducting to metallic transition.

