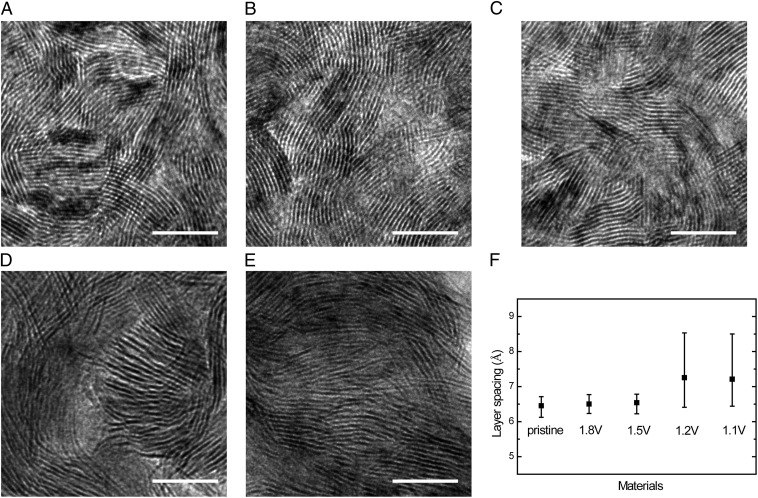
Fig. 2.
TEM images of MoS2 after Li intercalation. (A) TEM image of pristine MoS2 with molecular layers perpendicular to the substrate. (B–E) TEM images of MoS2 by Li electrochemical intercalation to 1.8, 1.5, 1.2, and 1.1 V vs. Li+/Li, respectively. (F) Averaged layer spacing of pristine and lithiated MoS2. Error bars represent the layer spacing variation of different grains measured in TEM images. Scale bar, 10 nm.

