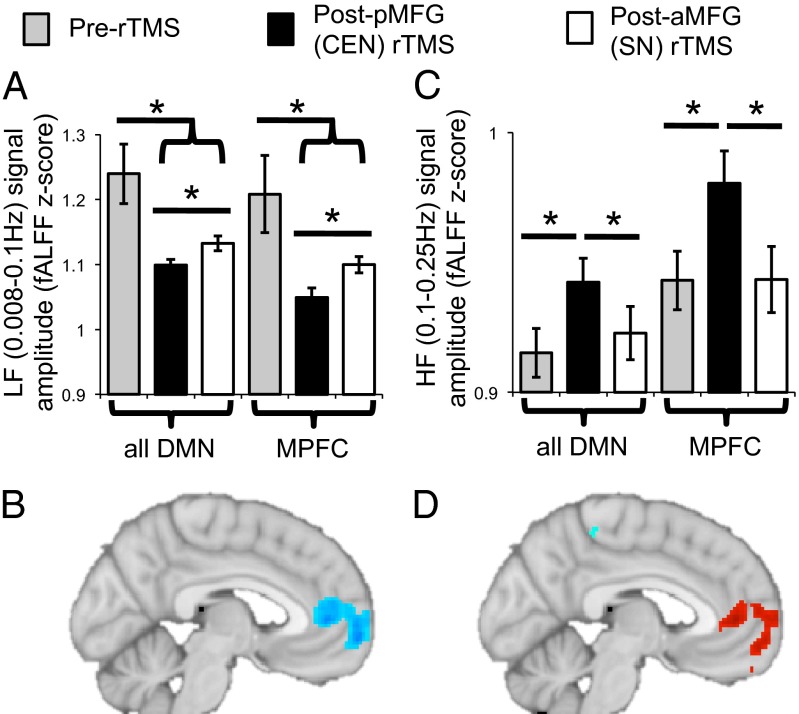
Fig. 4.
Disinhibition of endogenous DMN activity after 1-Hz rTMS to the pMFG (CEN node), as reflected by (A) a shift of DMN signal, primarily in the MPFC (B), from lower frequencies (0.008–0.1 Hz) to (C and D) higher frequencies (0.1–0.25 Hz), plotted for the DMN (MPFC and PCC) or MPFC alone. The illustrative voxelwise maps show the difference in LF (B) or HF (D) signal amplitude for the difference between resting-state scans after 1-Hz pMFG rTMS compared with after 1-Hz aMFG rTMS (P < 0.005, uncorrected).

