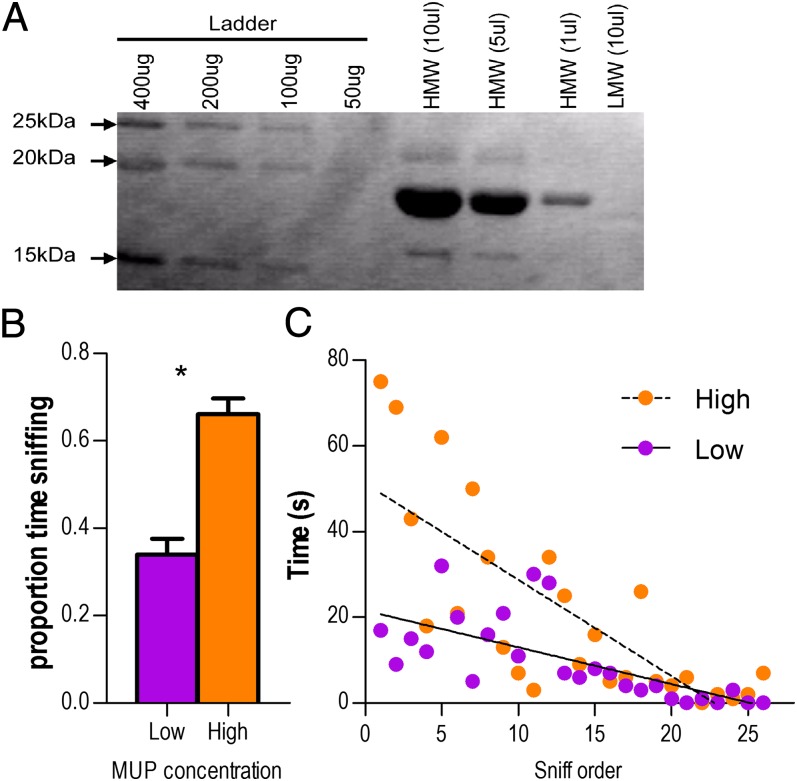
Fig. 5.
Female odor preference for increased MUP concentration. (A) SDS/PAGE of manipulated urine samples; shown are protein ladder, HMW (>10 kDa), and LMW (<10 kDa) fractions. HMW bands are MUPs. (B) Females spent significantly more time sniffing high-concentration than low-concentration spots. Means ± SE. (C) Females were more likely to visit high-concentration spots first (see Female Odor Preference for Up-Regulation of MUPs), and for a longer period, than low concentration spots. n = 12 trials.

