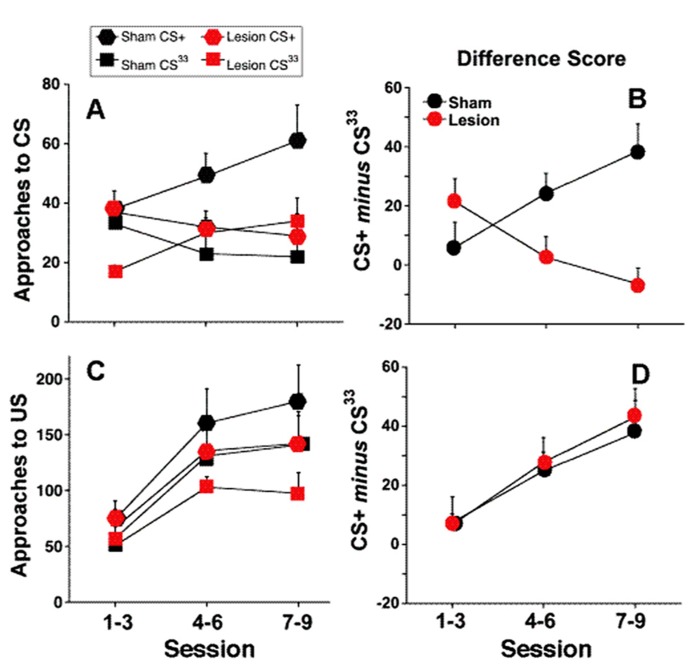
FIGURE 3.
Partial contrast conditioning schedule: (A,B) represent the effects of fr lesion on conditioned approach to each CS (A) and to the US (B) during the presentation of a 100% CS+ and 33% CS- presentation. (C,D) represents the difference score (CS+ minus CS33) derived from values represented in (A,B). n = 6, 7 for the Sham and Lesion groups, respectively. Error bars represent S.E.M.

