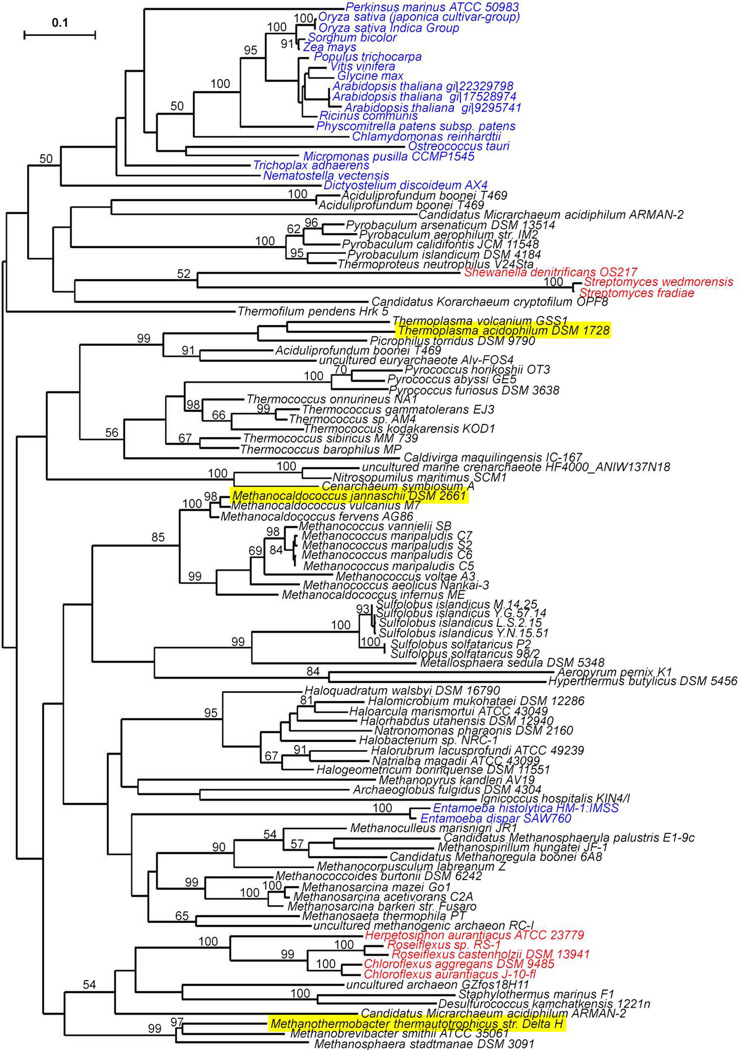
Figure 1.
Best maximum likelihood phylogenetic tree for IPK homologues. Sequences from Archaea (black), Eukaryota (blue), and Bacteria (red). IPKs characterized are underlined. Bootstrap values are not shown where bootstrap consensus tree disagreed with the best tree or values are less than 50. The tree is unrooted.

