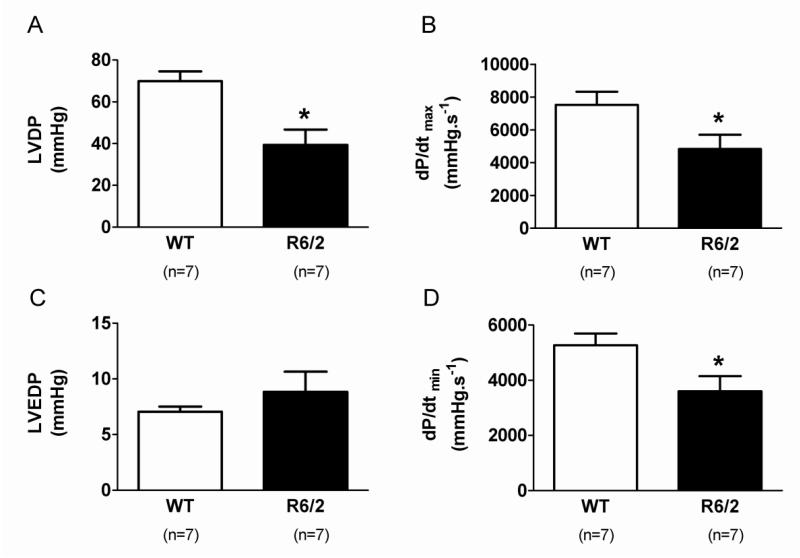
Figure 1. Cardiac systolic and diastolic function measured from Langendorff preparations.
Panel A shows left ventricular developed pressure (LVDP), and panel B left ventricular end diastolic pressure (LVEDP). dP/dtmax and dP/dtmin are shown in C and D. Data are means ± SEM. Significant differences are R6/2 compared to WT mice. * p<0.05

