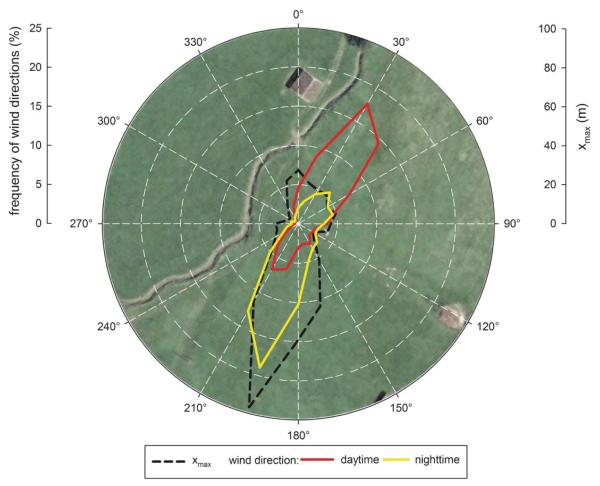
Fig. 1.
Polar plot of the maximum of the footprint function xmax (dashed black line) and the frequency the wind direction during daytime (red line) and nighttime (yellow line) overlaid on an aerial picture (TIRIS, http://tiris.tirol.gv.at/) of the study site.

