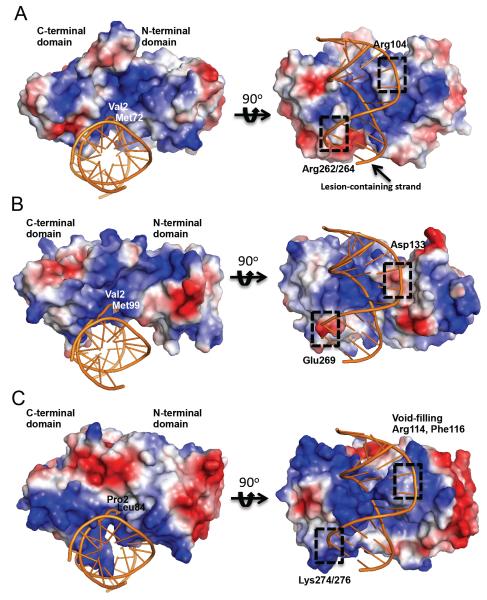
Figure 6.
Surface representation of MvNei2 and comparison with MmuNeil3 and MvNei1. Surface electrostatic potential of (A) MvNei2 superimposed with MvNei1-DNA (COOT [41]) where only the DNA is displayed (PDB ID 3A46, orange); (B) MmuNeil3 superimposed with the above DNA; (C) MvNei1-bound to DNA (PDB ID 3A46). All surfaces were created in PyMOL (vacuum electrostatics option, The PyMOL Molecular Graphics System, Version 1.5.0.4 Schrödinger, LLC.). The surfaces are colored according to electrostatic potential, where blue and red signify positive and negative charges, respectively. The scale is ±78 kT/e for all surfaces.

