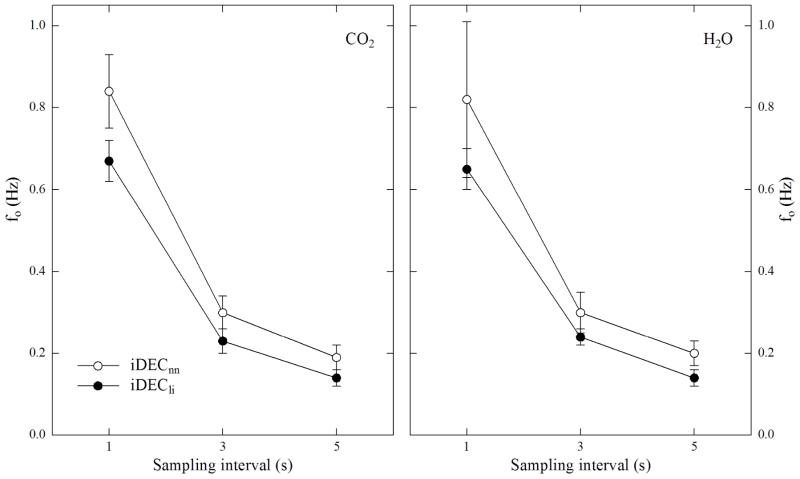
Figure 5. Parameter fo from Eq. (3) describing the additional low-pass filtering effect induced by the iDECnn and iDECli methods.
Error bars refer to ± 1 standard deviation. Lines represent best fits to the data using the following equations, where ΔT (s) refers to the sampling interval:
iDECnn: fo(CO2) = 0.8897 ΔT−0.9625, fo(H2O) = 0.899 ΔT−0.9434;
iDECli: fo(CO2) = 0.6834 ΔT−0.9346, fo(H2O) = 0.6645 ΔT−0.9278.

