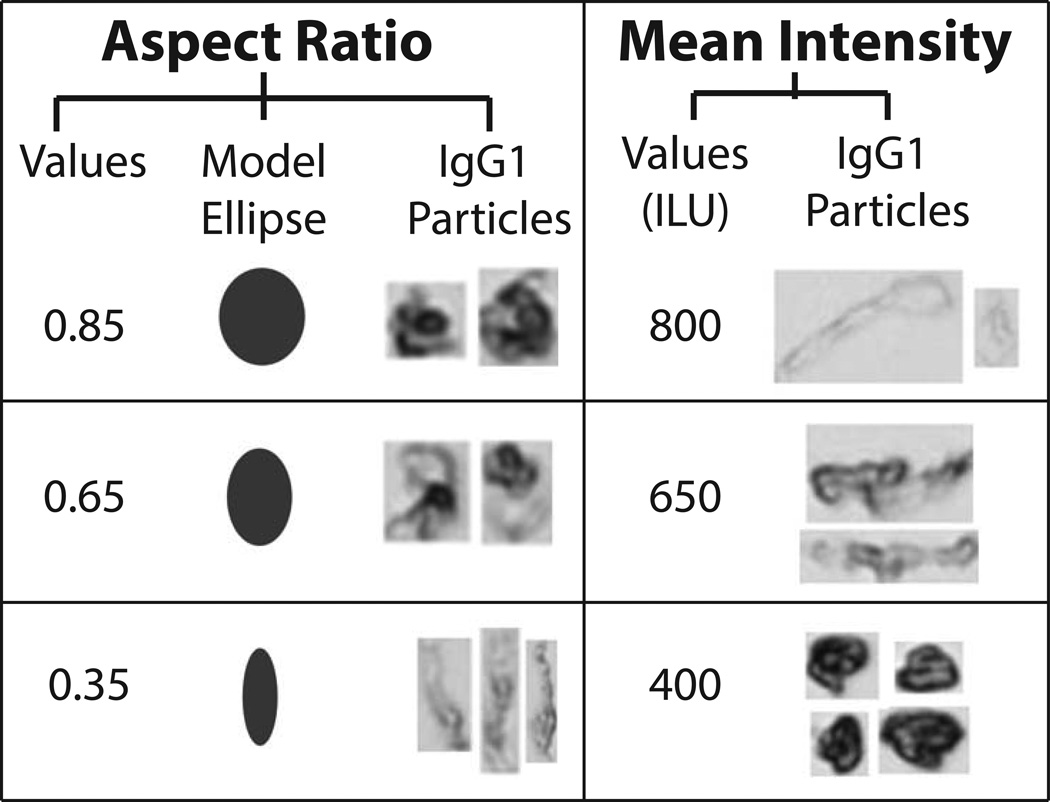
Figure 3. Representative morphological parameters for protein particles from MFI analysis.
Examples of three different aspect ratios and intensity values (low, moderate, and high) are presented along with corresponding IgG1 mAb particle images from MFI. Model ellipses of equivalent aspect ratios are presented to help visualize changes in particle shape. For ease of presentation, protein particle images from MFI are not presented to scale.

