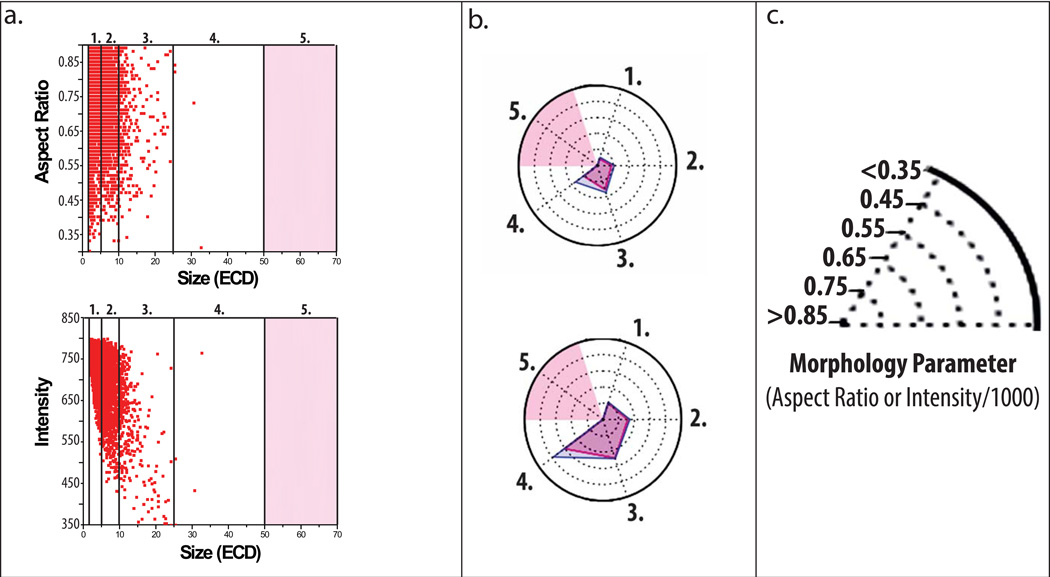
Figure 4. Application of radar chart array analysis to evaluate subvisible protein particle morphological parameters measured by MFI.
(a) Scatter plots of a subset of particle data displaying aspect ratio (top) and intensity (bottom) versus ECD (first 3,000 from n=1 experiments) counted within an IgG1 mAb solution containing 20 mM citrate buffer at pH 8.0 and 0.15 M NaCl subjected to 4 h of shaking. Light red shading represents size bins with insufficient data as defined by x < 25 particles counted. (b) Radar chart presentations of the same experiment showing average aspect ratio (top) or intensity/1000 (bottom) per size range except with the complete data set (~200,000 particles, n=3); each numerical axis in the radar chart is an equivalent size range to the corresponding numbered region in the scatter plots. The perimeter of the outermost polygon displays the mean morphology parameter, the perimeter of the polygon labeled ‘mean + SD’ displays the mean plus one standard deviation, and the distance between the perimeters of the two polygons (along an axis) is one standard deviation. (c) Illustration of the scale/units used in the radar charts to display experimentally measured (MFI) subvisible particle aspect ratio and intensity/1000 values.

