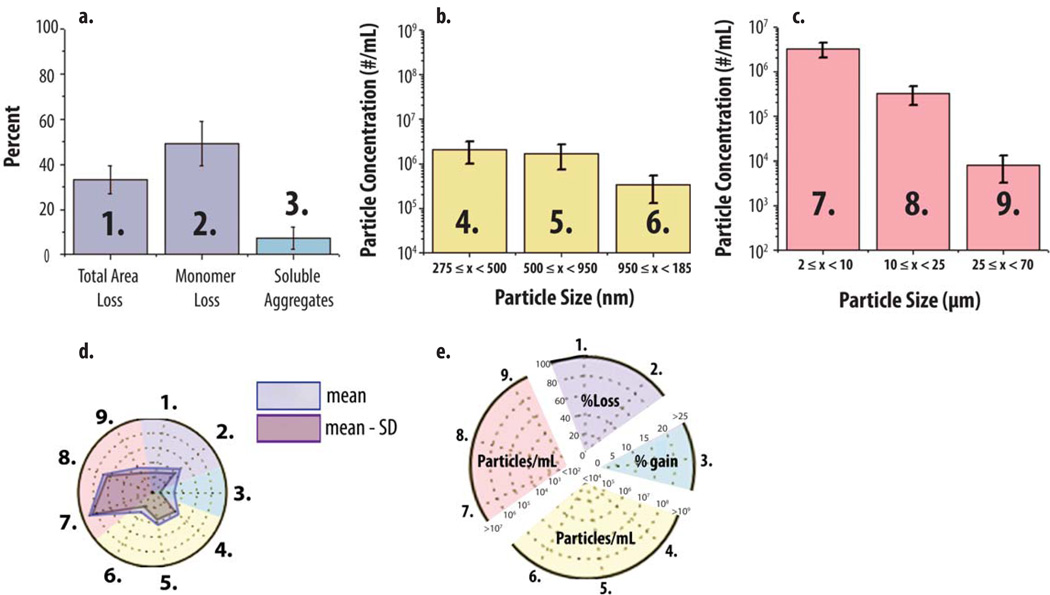
Figure 6. Application of radar chart array analysis to protein aggregate and particle formation data from multiple analytical techniques.
An IgG1 mAb solution containing 20 mM citrate phosphate buffer (pH 6.0) and 0.15 M NaCl was heated at 65°C for 120 min and the levels of soluble aggregates, submicron and subvisible particles were measured using SEC, RMM and MFI, respectively. (a, b, c) Bar graph (n=3) of SEC, RMM particle concentrations (0.275–1.85 µm) and MFI particle concentrations (2–70 µm). (d) Radar chart presentation of the same data sets shown bar graphs (a,b,c). The SEC, RMM and MFI data denoted 1–3, 4–6 and 7–9 in the bar charts (a, b, c, respectively) corresponds to axes 1–3, 4–6 and 7–9 in the corresponding radar chart (d). The perimeter of the outermost polygon in the radar chart displays the mean value (particle concentration or area gain/loss), the perimeter of the polygon labeled ‘mean - SD’ represents the mean value minus one standard deviation, and the distance between perimeters of the two polygons (along an axis) is one standard deviation. (e) Illustration of the numerical scales and units for the radar chart axes with different scales being highlighted with distinct background colors for results from SEC (1,2,3), RMM (4,5,6) and MFI (7,8,9), respectively.

