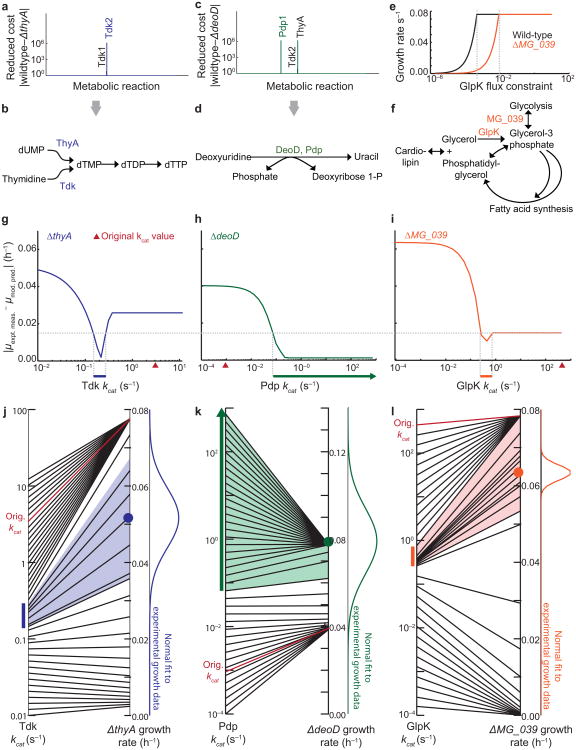
Figure 2.
The whole-cell model quantitatively predicts rate constants of metabolic reactions. (a,c) Reduced cost analysis of the metabolic fluxes in the ΔthyA (a) and ΔdeoD (c) single-gene disruption strains. Reduced costs for all of the metabolic fluxes in the model are shown, but only the notable costs are labeled. (b,d) Schematic of metabolic reactions which can compensate for those catalyzed by ThyA (b) and DeoD (d). (e) Plot indicating that constraining the flux of the GlpK reaction reduces the ΔMG_039 specific growth rate (orange) more dramatically than in the wild-type (black). (f) Reaction schematic including the MG_039 and GlpK-catalyzed reactions. (g-i) The magnitude of error between the mean model prediction (n = 6) and the mean experimental measurement (n = 5) of Tdk (g), Pdp (h), and GlpK (i) specific growth rates (μ) changes with the kinetic rates of the reactions. The cutoff for acceptable error (dashed horizontal line) for all strains was constrained by the local minimum observed in the ΔMG_039 strain. The model-predicted ranges are indicated by colored horizontal bars just below the x-axis. (j-l) The mapping of Tdk (j), Pdp (k), and GlpK (l) kcats (at left) to model-predicted specific growth rates of ΔthyA, ΔdeoD, and ΔMG_039 (at right). The colored bars are the same kcat ranges shown in (g-i), and the colored region indicates the range of simulated specific growth rates determined by the kcat range. A normal fit to the experimental specific growth rate data is shown at right for comparison to simulated values, and the original estimate of the kcat used to train the model, together with its corresponding simulated specific growth rate, is shown in red.

