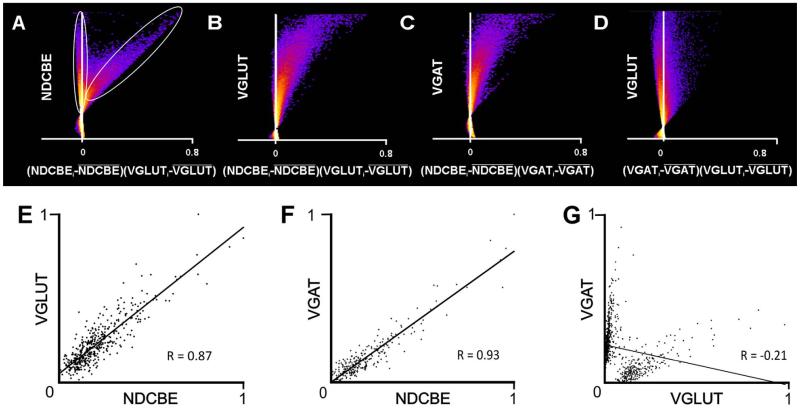
Figure 8.
Scatterplots quantify extent of co-localization. A-D: Intensity correlation plots (designed to assess co-localization for all pixels in a micrograph); “hot” colors represent high density of data points, “cold” colors represent low densities. Dots to the right of the Y-axis indicate positive correlation. The scatterplots are from the raw confocal image used to generate the illustration in Figure 4A. A: Plots NDCBE brightness against VGLUT1 brightness (normalized to its mean value). The data fall into two clouds; the vertical ellipse indicates pixels that exhibit essentially no relationship between NDCBE and VGLUT1, whereas the tilted ellipse indicates pixels that exhibit a strong positive correlation These data suggest that most, but not all NDCBE staining co-localizes with VGLUT1. B,C: Confirmation of substantial co-localization of both VGLUT1 and VGAT with NDCBE. D: In contrast, there is virtually no evidence of co-localization between VGLUT1 and VGAT. E-G: Scatterplots were constructed to define the extent of co-localization within puncta (as defined by both NDCBE and VGLUT1 [E, 443 puncta], both NDCBE and VGAT [F, 254 puncta], or both VGLUT1 and VGAT [G, 692 puncta]). Axes show mean pixel brightness, normalized to run from zero (dimmest punctum) to 1 (brightest). The strong correlation in brightness between the two channels for VGLUT1 and NDCBE (E) and for VGAT and NDCBE (F) contrast with the lack of correlation between VGLUT1 and VGAT (G).

