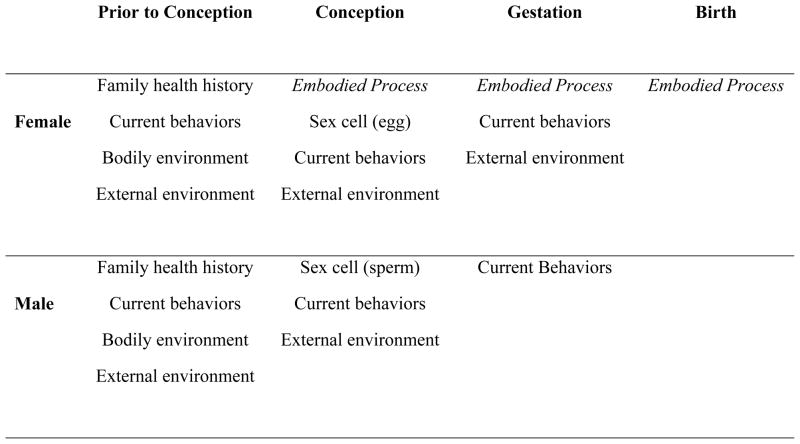
Figure 1. Women’s and Men’s Reproductive Contributions by Stage.
Note: Since we are interested in biological similarities and differences, we have represented the two partners as female and male, but the chart could be adapted for single parents, same-sex couples, and those who use reproductive technologies such as egg/sperm donation or surrogacy.

