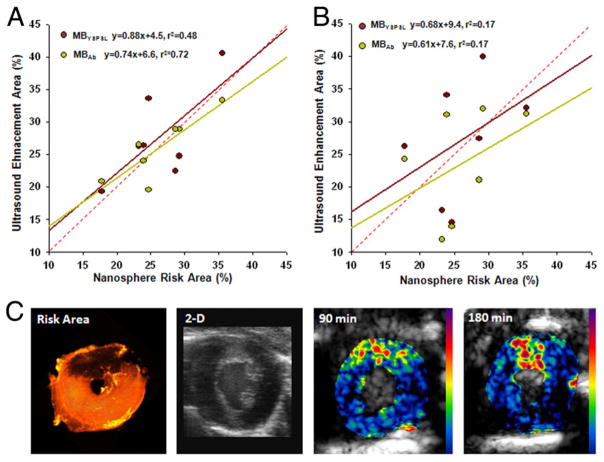
Figure 6. Spatial Assessment of Recent Ischemia With Molecular Imaging.
Relation between risk area determined by fluorescent nanospheres and region of enhancement during molecular imaging at either (A) 90 min or (B) 3 h. Regression line colors correspond to their respective data points; red dashed line = line of identity; p < 0.05 only for 90-min correlations. (C) Example of a myocardial short-axis section illustrating the nanosphere-derived risk area in the anterior myocardium (dark region), two-dimensional high-frequency imaging as an anatomic reference, and myocardial contrast echocardiography molecular imaging with MBYSPSL obtained 90 min and 3 h after left anterior descending coronary artery ischemia-reperfusion injury. Cavity size differences are due to postmortem contracture. Abbreviations as in Figure 1.

