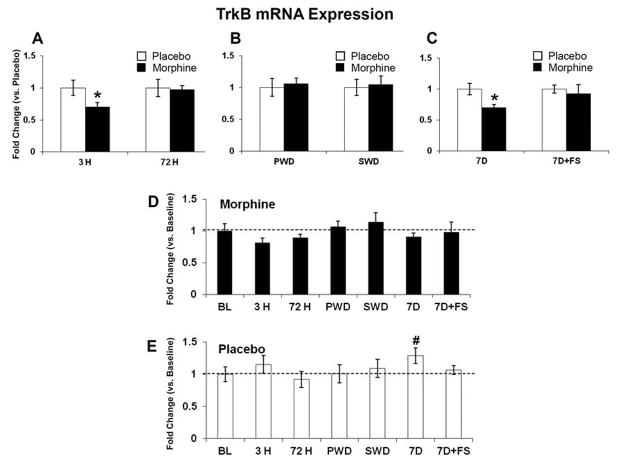
Figure 5. TrkB mRNA expression.
TrkB mRNA was quantified relative to placebo (AC), and baseline (D and E). TrkB mRNA expression was decreased after 3 hours of morphine exposure; no differences were seen at 72 hours of morphine exposure (A). No differences were seen in either withdrawal group (B). TrkB mRNA expression was also decreased following seven days of abstinence (C). There were no differences in the morphine groups compared to baseline (D), but there was a significant increase in placebo at 7 days (E). Data indicate mean ± SEM. * P < 0.05 vs. placebo; # P < 0.05 vs. baseline by Student’s t-test. Baseline data: BL (n=8); placebo: 3 H (n=6), 72 H (n=6), PWD (n=6), SWD (n=5), 7D (n=6), 7D+FS (n=6); morphine: 3 H (n=6), 72 H (n=7), PWD (n=7), SWD (n=5), 7D (n=5), 7D+FS (n=6).

