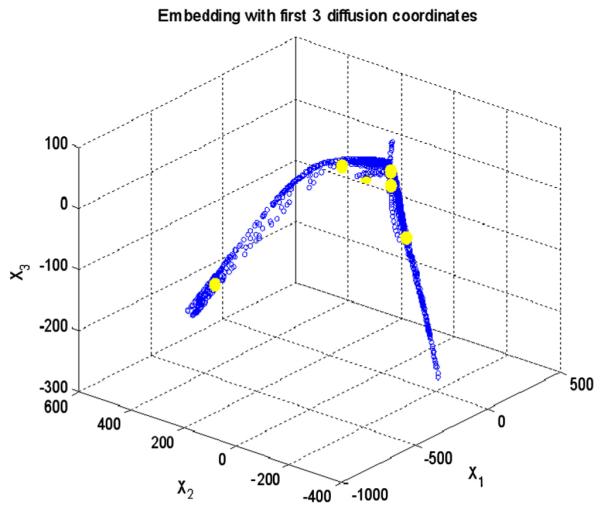
Fig. 20.

Applying the k means clustering on diffusion coordinates of the second diffusion map in 3D, the cluster centroids are shown in yellow and three axes are three most important eigen functions. (For interpretation of the references to color in this figure legend, the reader is referred to the web version of this article.)
