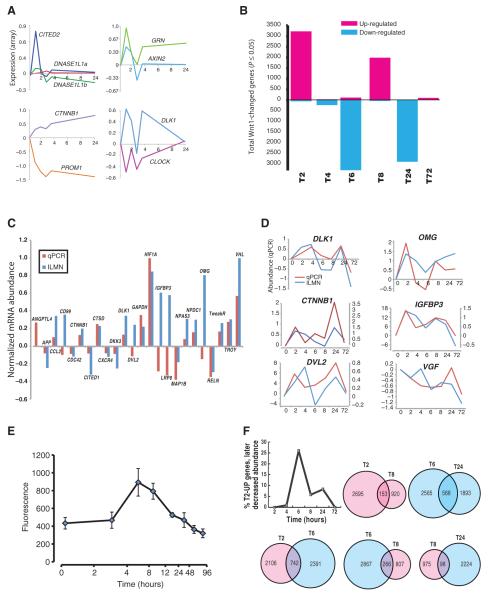
Fig. 1.
Wnt1-induced changes in the human neural progenitor transcriptome vary across time. (A) Representative genes showing common patterns of changes in gene expression over 24 hours, normalized to initial values. (B) Genes with significantly (P ≤ 0.05; t test) increased (magenta) or decreased (cyan) message abundance after Wnt1 application. (C and D) qPCR validation of microarray data. (C) Bars are range-normalized changes in expression (2 hours versus control) showing high correlation in directionality of expression, array (ILMN) versus qPCR (ρ = 0.48, n = 24 genes; one-tailed P ≤ 0.01). (D) Time series plots showing high correlation between qPCR- and microarray-quantified transcript. (E) Canonical Wnt reporter: Wnt1 applied to hNPs stably expressing a LEF/TCF-dsGFP reporter (n = 4 cultures) (139) causes a time-dependent increase in canonical activity that peaks between 4 and 6 hours. (F) Overlap in gene expression changes across time. (Upper left) Plot showing the fraction of genes whose message increased at 2 hours, but consistently decreased at subsequent time points. (Top, left to right) Venn diagrams showing the overlap of genes whose message increased (magenta) at both 2 and 8 hours or decreased (cyan) at 6 and 24 hours. (Bottom) Venn diagrams of genes whose message increased at 2 hours and then down-regulated at 6 hours (left), down at 6 hours then up at 8 hours (middle), or up at 8 hours and down again by 24 hours (right).

