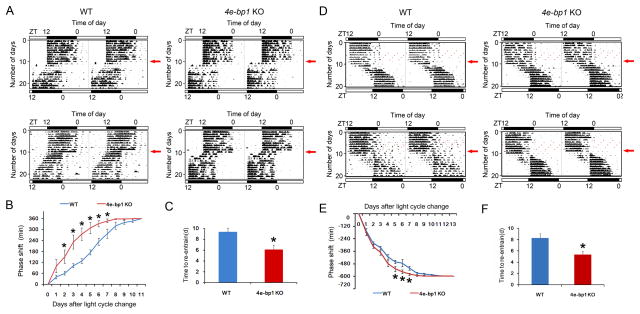
Figure 2. Accelerated Circadian Behavioral Re-entrainment in Eif4ebp1 KO Mice (see also Figure S2).
A and D. Representative double-plotted actograms of wheel-running activities from two WT (left) and two Eif4ebp1 KO mice (right). The x-axis (top) indicates the Zeitgeber time (ZT) of the day. The y-axis (left) indicates the number of days during the experiment. For these experiments, the animals were entrained to a 12 h/12 h light/dark (LD) cycle for 10 days, and on the 11th day, the LD cycle was either advanced for 6 h (light on at previous ZT18)(A) or delayed for 10 h (light off at previous ZT22) (D). Red arrows (right) indicate the day when the light cycle was shifted.
B and E. Line graphs showing the daily phase advance (B) or delay (E) of wheel-running activities following a 6 h advancing LD cycle shift (B) or a 10 h delaying LD cycle shift (E). Values are presented as the mean ± SEM. Each data point is averaged from nine mice. *p<0.05 KO vs. WT by ANOVA.
C and F. Histograms showing time (in days) needed for the mice to re-entrain to a 6 h LD cycle advance (C) or a 10 h LD cycle delay (F). Values are presented as the mean ± SEM. Each data point is averaged from nine mice. *p<0.05 KO vs. WT by Student’s t-test

