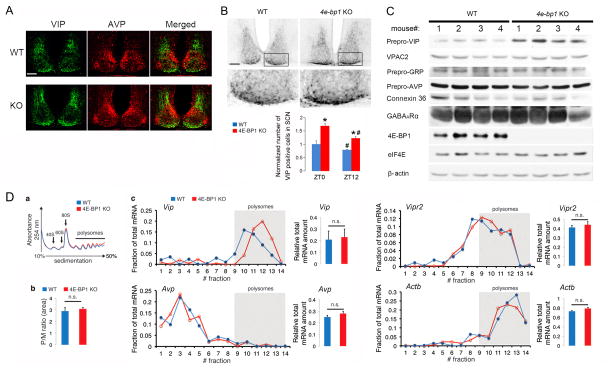
Figure 5. Regulation of VIP expression by 4E-BP1 (see also Figure S4).
A. Confocal microscopic images showing expression of VIP (green) and AVP (red) in the SCN. For these experiments, the mice were entrained and sacrificed at ZT0. Note that VIP and AVP expression pattern in the KO SCN was similar to that in the WT SCN. Scale bar: 100 μm.
B. Top: Representative bright-field microscopy images showing VIP immunostaining in the SCN. For these experiments, mice were sacrificed at ZT0. Note that number of VIP positive cells was increased in the Eif4ebp1 KO SCN. Scale bars: 100 μm. Framed regions are magnified to below. Bottom: Quantitation of number of VIP-positive cells in the SCN. The values are presented as the mean ± SEM. *p<0.05 vs WT;# p<0.05 vs ZT0 by ANOVA, Four animals were used for each group.
C. Western blots of whole-forebrain lysates. For these experiments, animals were sacrificed at ZT0. The numbers 1–4 indicate four different animals for each group. Note that prepro-VIP, but not VPAC2, prepro-GRP, prepro-AVP, Connexin 42 or GABAARα was significantly increased in the brain of Eif4ebp1 KO mice. eIF4E and β-actin were used as loading controls. See Results section for quantitation of the blots.
D. Brain polysome profiling assay. (a) Polysome profiles from whole-brain lysates. The positions of the 40S, 60S, and 80S ribosome peaks and polysomes are indicated. (b) Polysome to monosome ratio. No difference was found between WT and Eif4ebp1 KO profiles (n=3, p>0.05, Student’s t-test). (c) Left figures show qRT-PCR results of Vip, Avp, Vipr2 and Actinb on RNA extracted from whole-brain polysome fractions. qRT-PCR results on total mRNA extracted from brain lysates are shown to the right. Note that for Vip mRNA distribution, a shift to the right (heavier gradient fractions) indicates increased translation initiation (n=3). No significant shifts were detected on distribution profiles of Avp, Vipr2 or Actinb mRNAs. No differences were found in Vip, Avp, Vipr2 and Actb transcription between WT and Eif4ebp1 KO (n=3, p>0.05 by Student’s t-test).

