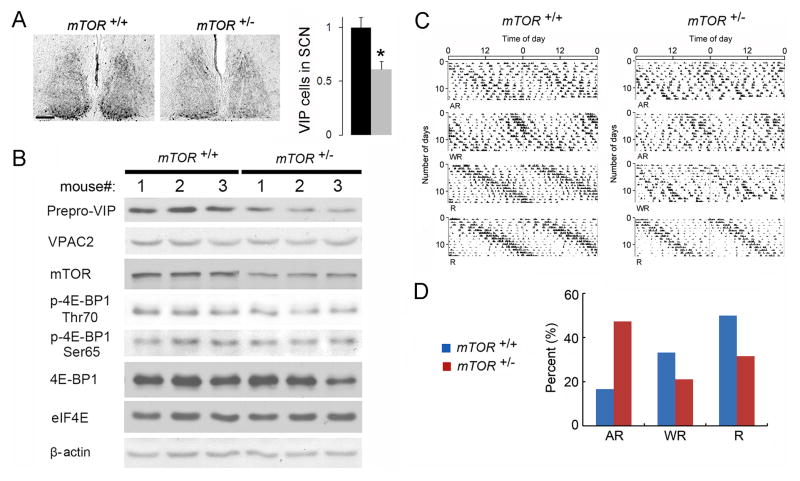
Figure 7. Decreased VIP Expression and Increased Susceptibility to Constant Light-Induced Clock Desynchnony in Mtor+/− mice.
A. Representative bright-field microscopy images showing VIP immunostaining in the SCN. Mice were entrained and sacrificed at ZT0. Quantitation of VIP expression in the SCN is shown to the right. The values are presented as the mean ± SEM. Five mice were used for each group. *p<0.05 by Student’s t-test. Note that number of VIP positive cells was decreased in the Mtor+/− SCN. Scale bars: 100 μm.
B. Western blots of whole-forebrain lysates. Animals were sacrificed at ZT0. The numbers 1–3 indicate three different animals for each group. Note that mTOR expression and 4E-BP1 phosphorylation was decreased in the brains of Mtor+/− animals. Accordingly, prepro-VIP, but not VPAC2, expression was decreased in these mice. eIF4E and β-actin were used as loading controls. See Results for quantitation of the blots.
C. Representative wheel-running actograms of mice in constant light. Actograms from four Mtor+/+ (left) and four Mtor+/− (right) mice are shown. R, rhythmic; AR, arrhythmic; WR, weakly rhythmic. Note that more Mtor+/− mice exhibited arrhythmic behavior compared to Mtor+/+ mice. The percentages of three types of behavior are shown in D.

