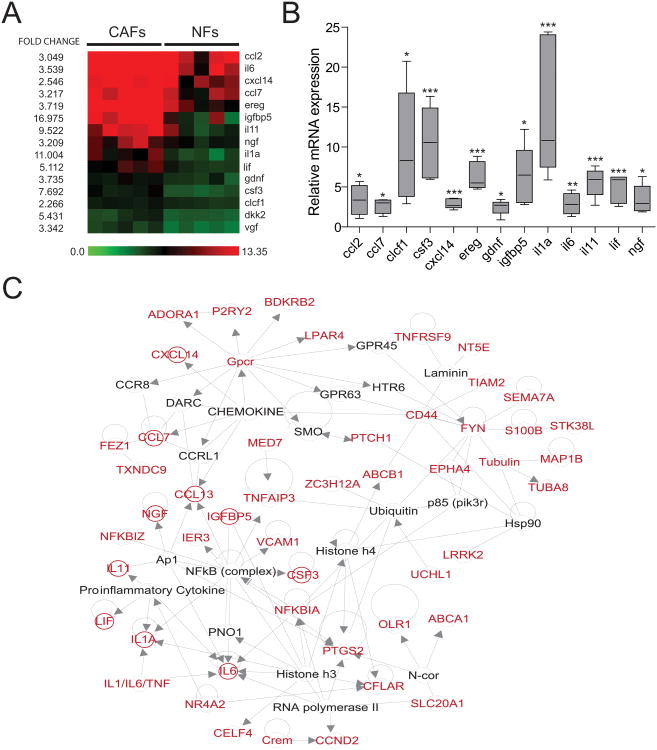
Figure 2.
A secretory and inflammatory gene signature specific to CAFs. A. Heat map of soluble ligands identified in the CAF gene signature. B. mRNA expression analysis of the 15 genes identified in A. Results are shown as CAF expression (n=5 samples) relative to average NF expression (n=5 samples) for each gene indicated in the X axis. C. 2D representation of network 1 obtained using Ingenuity Pathway Analysis (IPA) software. Genes in red correspond to those with a fold change >2 in CAFs. Secreted proteins are highlighted by red circles. Lines indicate interaction between two genes and arrows show direction of a gene interaction when information is publicly available.

