Figure 5.
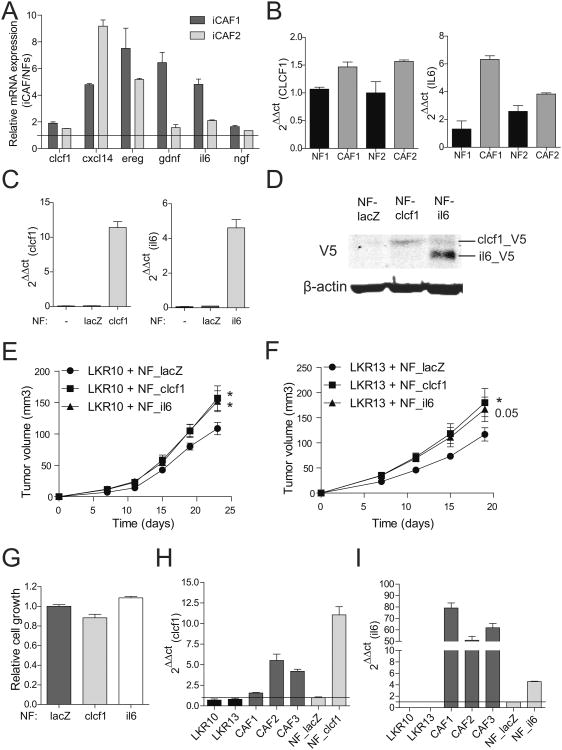
Clcf1- and il6-expressing NFs enhance tumor growth in vivo. A. mRNA expression levels of clcf1, cxcl14, ereg, gdnf, il6 and ngf analyzed in two iCAF lines analyzed by qRT-PCR. Results are normalized against NF gene expression levels. B. Expression levels of CLCF1 and IL6 mRNA in human NFs and CAFs were assessed by qRT-PCR. C. mRNA expression levels analysis in NFs overexpressing clcf1 and il6. D. V5-tag protein detection by Western blot of cells in C. Cells were treated with 10μg/ml brefeldin A and 5μg/ml monensin for 5h to inhibit the secretory pathway and facilitate protein detection by Western blot. E and F. Xenograft experiment of LKR10 and LKR13 injected with control lacZ-, clcf1-, or il6-overexpressing NFs. Graphs show averaged tumor volume at indicated time points (n=10 injections per group). Endpoints are 23 days (LKR10) and 19 days (LKR13). Error bars indicate ± s.e.m. All p values are for a two-tailed t-test. G. Cell proliferation assay of NFs overexpressing lacZ, clcf1 and il6 at day 3 of experiment, as measured by MTT. H and I. mRNA expression levels of tumor cells (LKR10 and LKR13), primary CAFs, control NFs and NFs overexpressing either clcf1 or il6 assessed by qRT-PCR. Results are relative to NFs_lacZ (black line).

