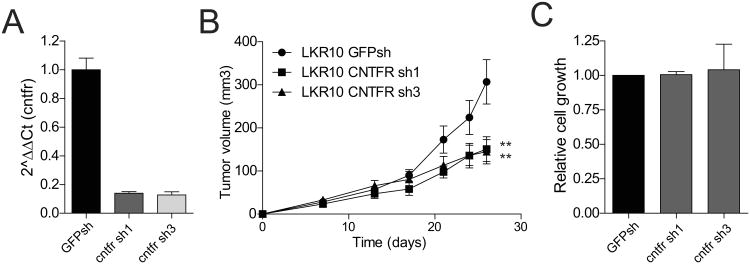
Figure 6.
Decrease response to CAF-derived clcf1 in cntfr-depleted tumor cells. A. qRT-PCR analysis of LKR10 cells transduced with two independent shRNAs to cntfr or a control shRNA. B. Tumor volume analysis of xenografts including CAFs and cntfr-depleted LKR10 cells. Error bars indicate ± s.e.m. All p values are for a two-tailed t-test. Endpoint is 26 days. C. Cell viability analysis of LKR10 cells expressing cntfr shRNAs assessed by MTT.

