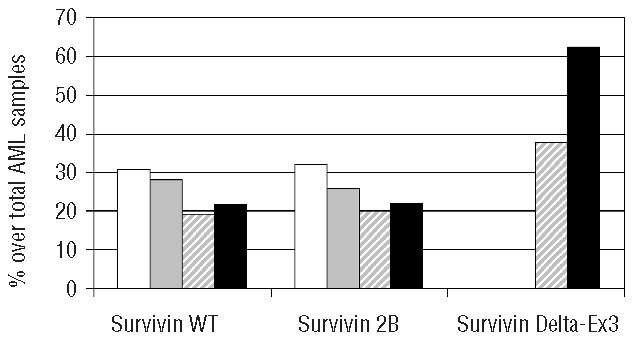
Figure 1.

Sub-compartmental localization of WT survivin and isoforms in AML. Y axis represents percentages of cases over total AML samples. White bars: expression in both cytoplasm and nucleus; gray bars: cytoplasmic expression only; gray-shaded bars: nuclear expression only, and black bars: no survivin expression.
