
Figure 4.
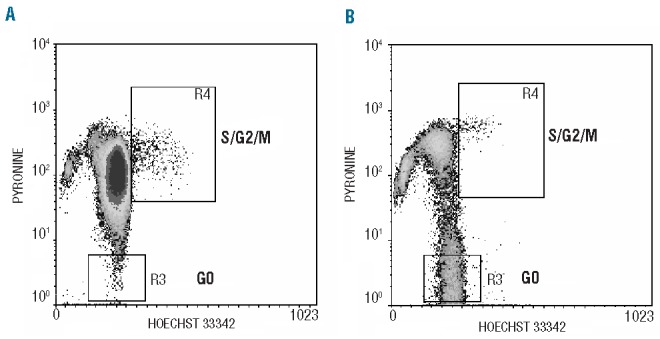
Cell cycle analysis of leukemic cells at diagnosis. In each dot plot, R3 displays G0 cells that are Hoechst 3342 positive but low/negative for the RNA-binding dye pyronin Y and R4 displays S/G2/M cells. Events were gated on forward and side scatter signals (R1) and CD34-CD33/CD38 expression (R2). To set up regions lymphocytes from chronic lymphoid leukemia were used. (A) A representative patient expressing cytoplasmic survivin WT and high levels of pSer473-Akt. (B) A representative patient lacking cytoplasmic WT survivin and negative for pSer473-Akt.