
Figure 4.
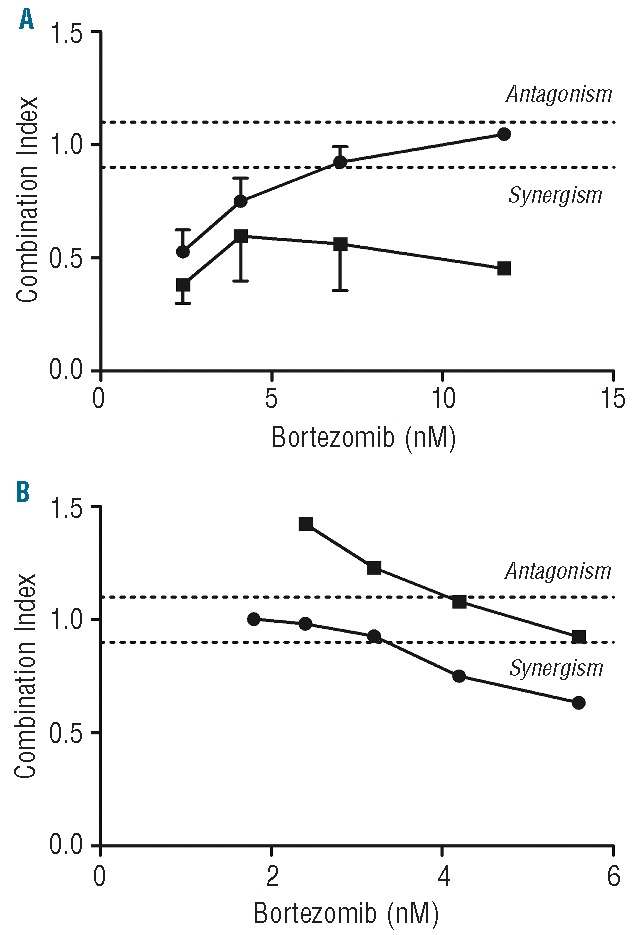
Combination Indices of bortezomib-dexamethasone combinations. (A) Mean CI of 3 representative dexamethasone concentrations per bortezomib concentration in patient samples. Symbols represent ALL (•) and AML (▪). For ALL (n=17), 1.5 nM, 11.7 nM, and 93.8 nM dexamethasone were selected, and for AML (n=6), 11.7 nM, 93.8 nM, and 750 nM dexamethasone were used. Antagonism (CI > 1.1) additivity (CI > 0.9 < 1.1), and synergism (CI < 0.9). Error bars represent standard error of the mean of 3 separate experiments. (B) Combination indices of T-ALL cell line CEM exposed to combinations of bortezomib and dexamethasone. Symbols represent (•) CEM pulsed for 1 h with 1 μM bortezomib prior to the combination assay and (▪) CEM control, not pulsed prior to the combination assay. Experiments were performed twice in triplicate. Results of the mean of these experiments are presented.