Figure 1.

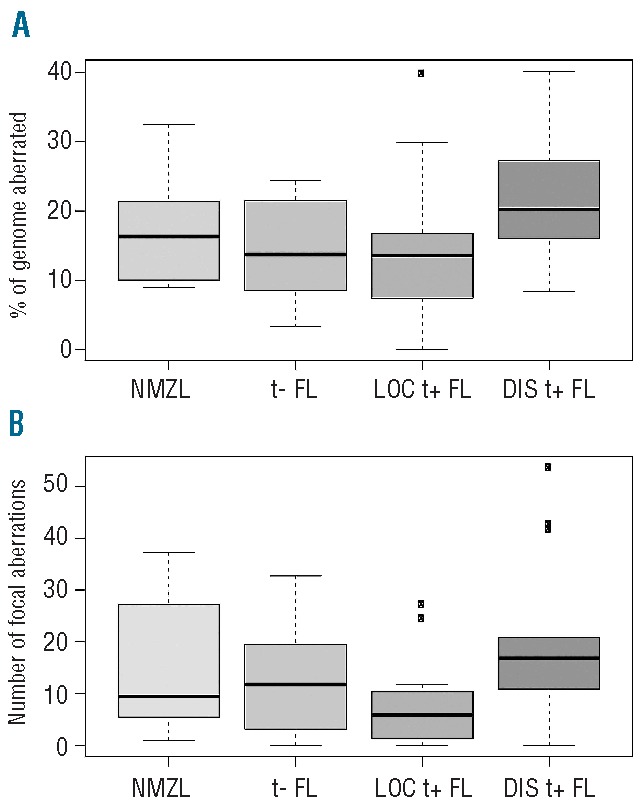
Number of aberrations in each group. (A) Percentage of the genome gained or lost and (B) number of somatic focal aberrations (<3 Mb) per group. t−: translocation-negative; t+: translocation-positive; LOC: localized; DIS: disseminated.

Number of aberrations in each group. (A) Percentage of the genome gained or lost and (B) number of somatic focal aberrations (<3 Mb) per group. t−: translocation-negative; t+: translocation-positive; LOC: localized; DIS: disseminated.