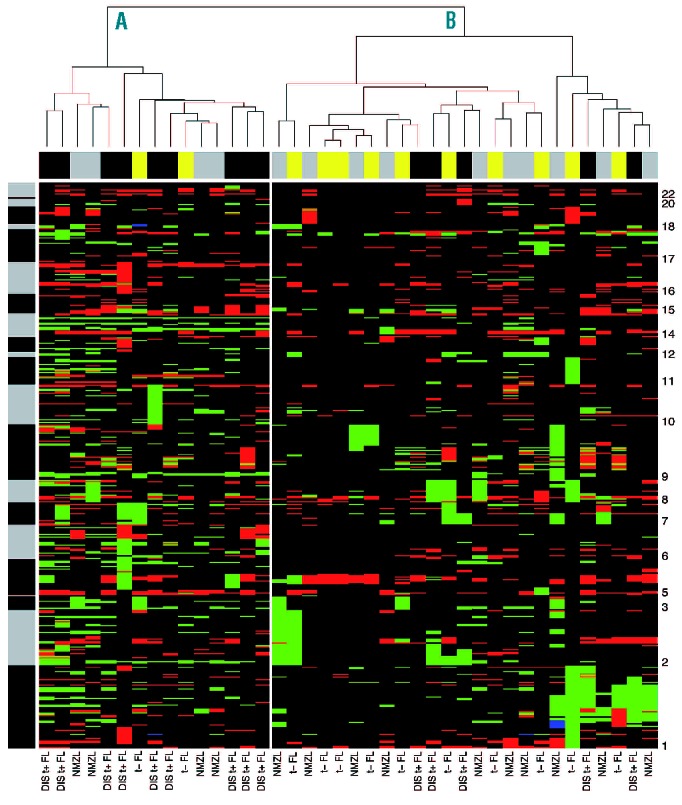
Figure 4.

Cluster analysis of translocation-negative (t−) FL, NMZL and disseminated translocation-positive (DIS t+) FL. Hierarchical cluster analysis yielded two clusters significantly correlated with tumor types (P=0.03). Columns represent the different tumors and rows represent the different chromosomal regions, with chromosome 1 at the bottom and chromosome 22 at the top of the heatmap. DNA copy number gains and losses are indicated in green and red, respectively. The black and gray bar next to the cluster represents the chromosome separation. The bar above the heatmap represents the different subgroups, t− FL in yellow, NMZL in gray and DIS t+ FL in black.
