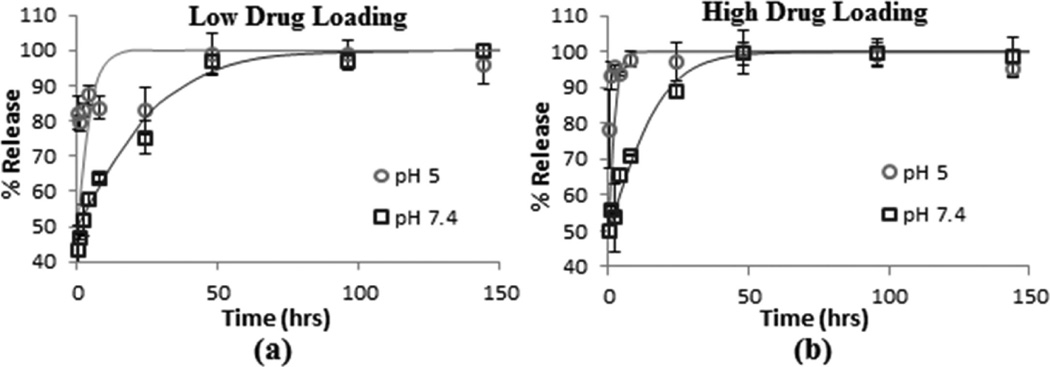
Figure 4.
Resiquimod release profiles measured for electrosprayed Ac-DEX/Tween 80 particles containing (a) low drug loading and (b) high drug loading. Error bars show the standard deviation for three independent particle suspensions. The solid lines, added as a visual guide, are sigmoidal functions of the form % Release = (100) × (1/(1 + e−t/τ)), where t is time and τ is the characteristic time for drug release.

