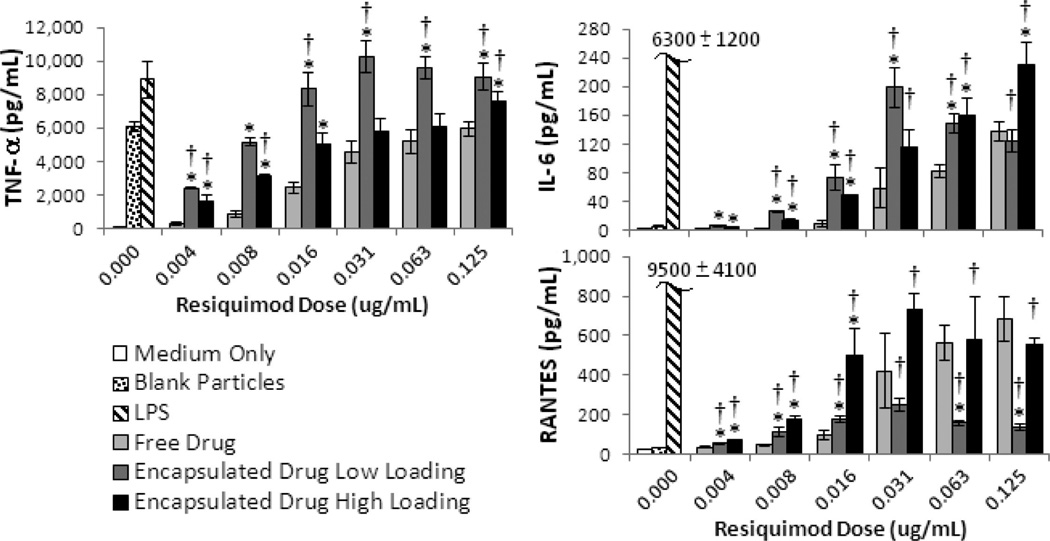
Figure 6.
Inflammatory cytokine production in RAW macrophages treated with free and encapsulated resiquimod. All graphs show cytokine results from triplicate wells. Error bars represent one standard deviation. An * indicates significant difference with respect to free drug at the same dose (p < 0.05). A † indicates a significant difference relative to the blank particle control (p < 0.05).

