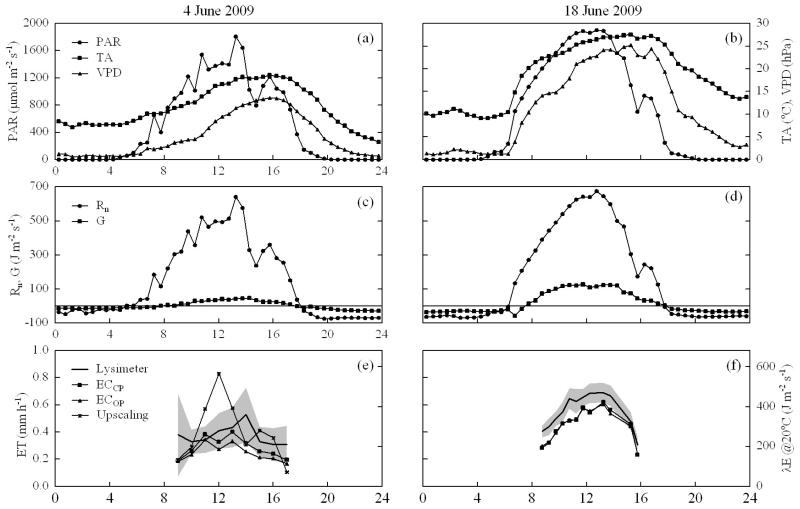
Figure 3. Diurnal courses of (a, b) photosynthetically active radiation (PAR, air temperature (TA), vapour pressure deficit (VPD), (c, d) net radiation (Rn), soil heat flux (G) and (e, f) evapotranspiration (ET).
The grey shaded area indicates one standard deviation (n = 6) around the mean of evapotranspiration measured by lysimeters. ET in energy units (λE; assuming an air temperature of 20°C) is shown on the secondary y-axis of the two lowermost panels for reference.

