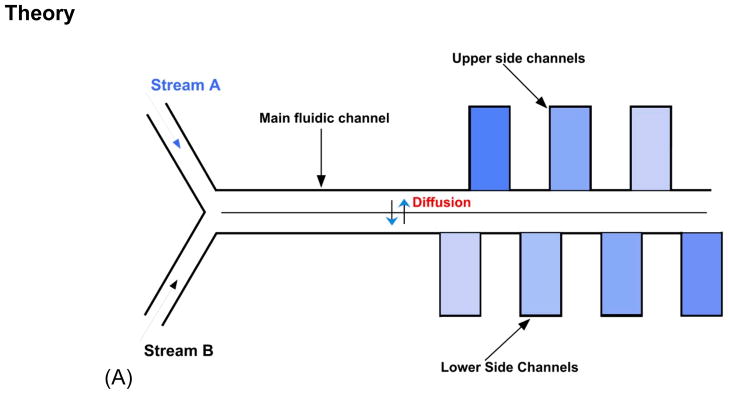
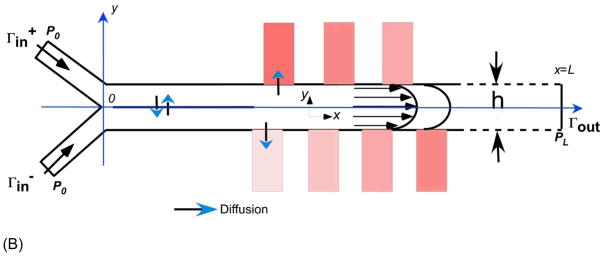
Figure 2.


(A) Visualization of microfluidic diffusion diluter and how gradient generates. (B) Scheme of the domain for the simulation of fluid flow and diffusion-convection process in microfluidic diffusion diluter. Rectangles on each side of the main channel represent cell culture chambers. The color change represents changes in concentration along the laminar mixing channel. A table with values of parameters is listed as Supporting Information.
