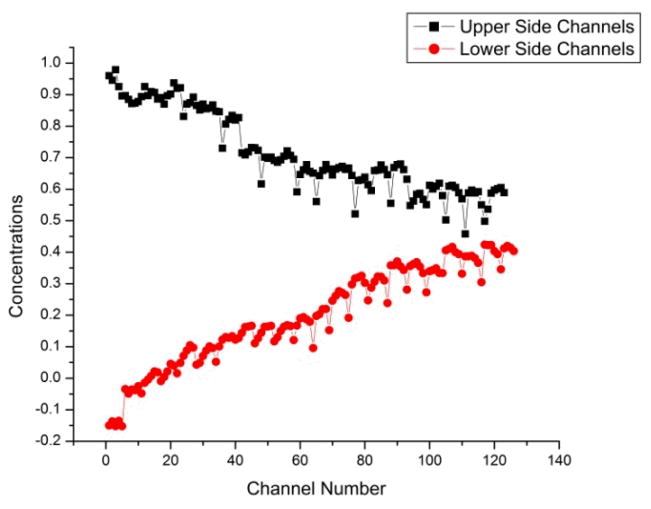
Figure 4.
The relationship between the concentration of the dye with distance along the chip (channel number). Black squares represent the concentration of the dye in upper side channels and red circles represent the concentration of the dye in lower side channels. Concentration values are obtained after the calibration of the chip.

