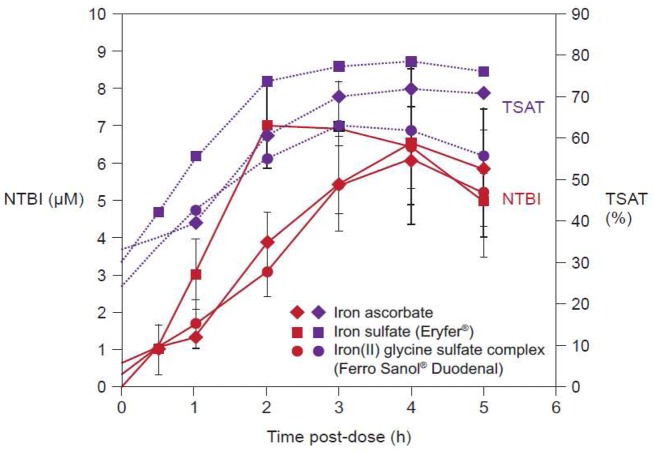
Figure 4.
Serum concentration of non-transferrin bound iron (NTBI) and percentage transferrin saturation (TSAT) following administration of a single oral dose of 100 mg iron in the form of three different ferrous salts to healthy adult volunteers. Broken blue lines indicate the percentage transferrin saturation (right-hand axis). Solid red lines indicate NTBI concentration (left-hand axis). Values shown are mean ± SD. Modified from Dresow et al. 2008 [34].

