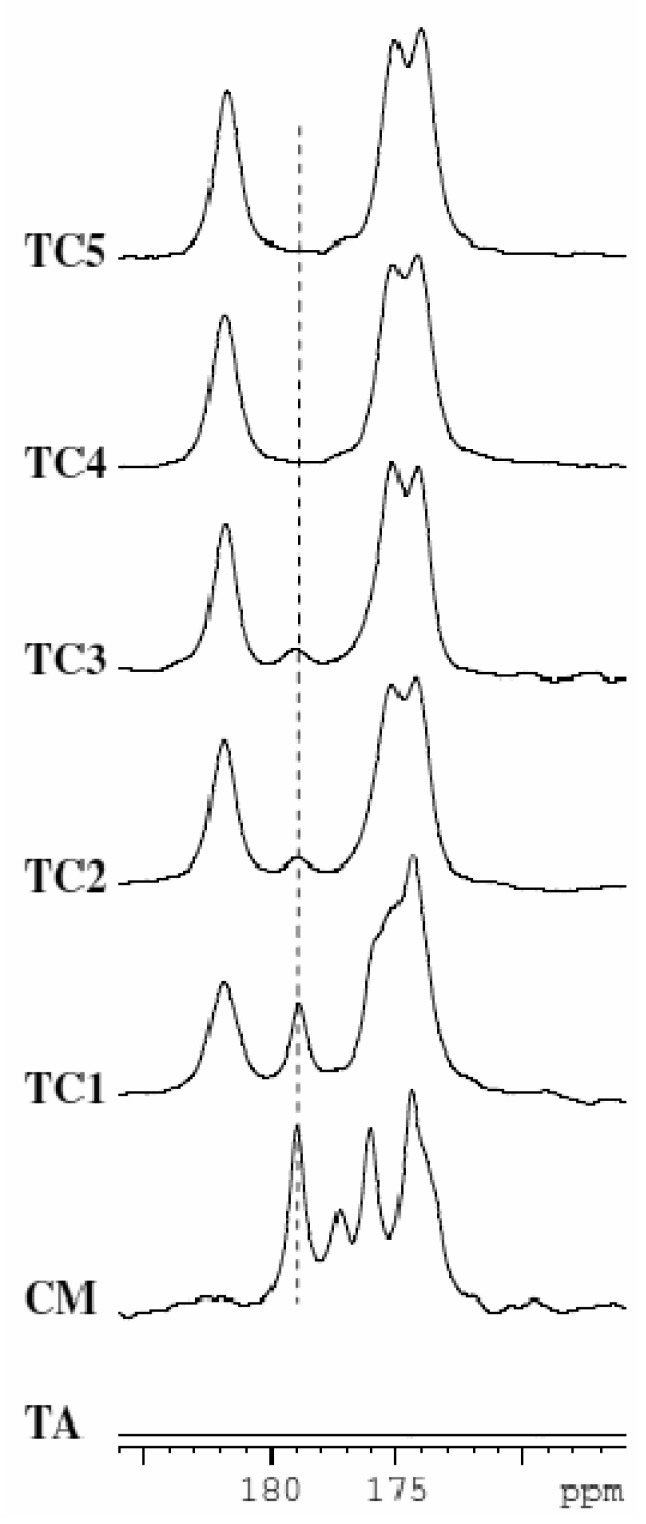
Figure 11.
13C CP/MAS spectra of samples TA: Anhydrous Theophylline (has no peaks in this ppm range), CM: Citric acid monohydrate, TC1, TC2, TC3, TC4, and TC5 (sample descriptions are shown in Table 2). The extent of conversion to the cocrystal follows the order TC1 < TC3 < TC2 < TC4 = TC5.

