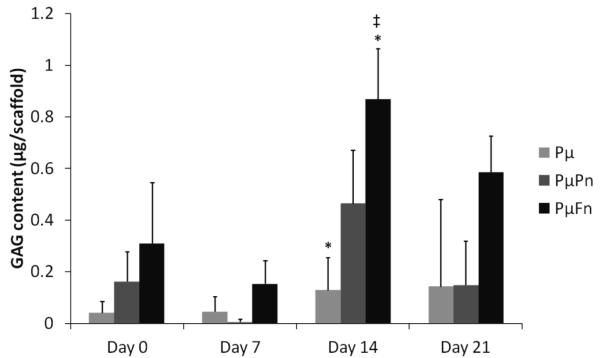
Figure 8.
GAG content of scaffolds at days 0, 7, 14, and 21 as determined by the DMMB assay. GAG contents are represented as mean ± standard deviation for n = 4 samples. Different scaffold types marked with an asterisk, “*”, indicate significant difference in GAG content for a specific time point. Statistical significance of a particular scaffold type at a specific culture period compared to both of the other scaffold types at every other time point is indicated by a “‡”.

