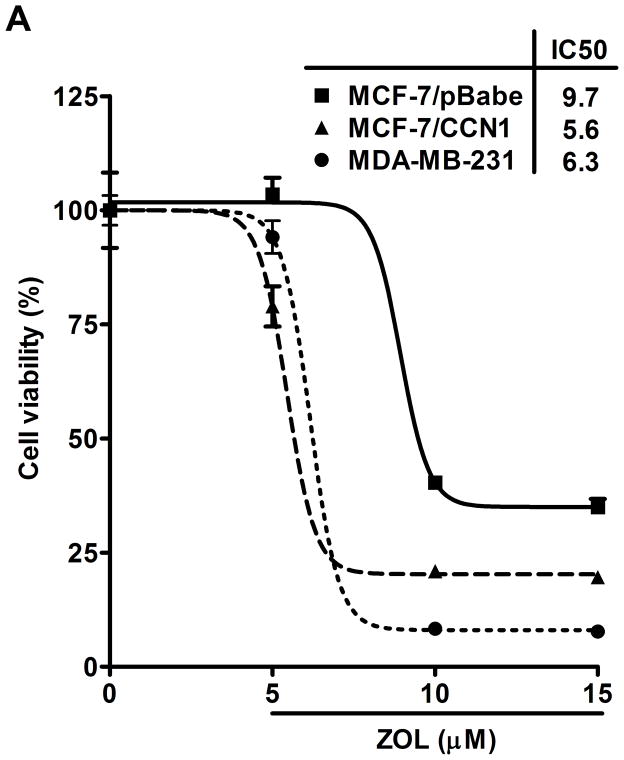
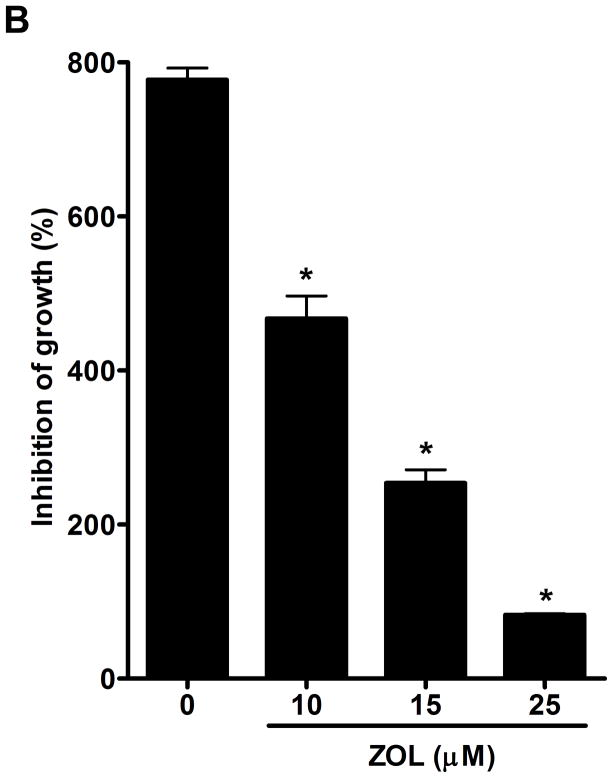
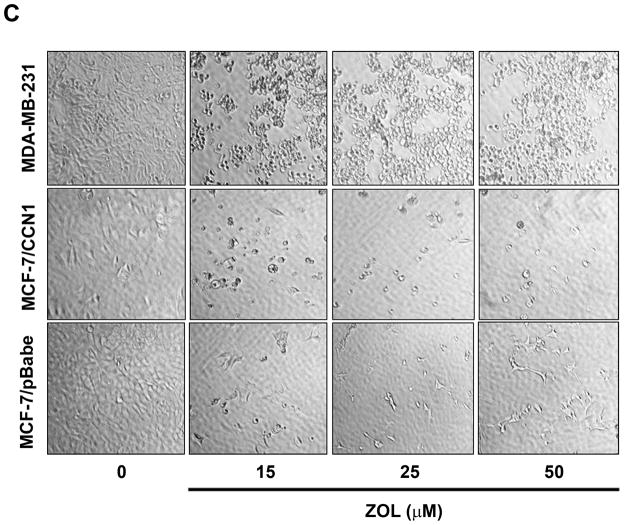
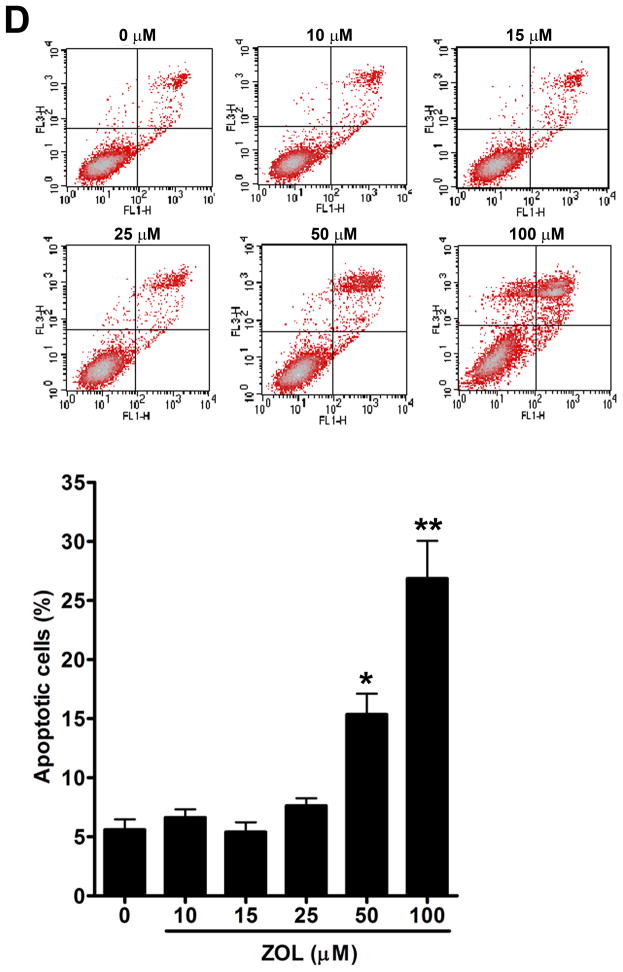
Figure 2. ZOL inhibits the growth and induces apoptosis in cells overexpressing CCN1.
A). In order to evaluate how ZOL affects metastatic breast cancer cell viability MTT-based metabolic assays (as described in Material and Methods) in cells overexpressing endogenous CCN1(MDA-MB-231) and CCN1 overexpressing cells (MCF-7/CCN1) were cultured in the absence or presence of equimolar concentrations of ZOL for 3 days. B). ZOL inhibits the anchorage-independent growth of MDA-MB-231 cells. The ability of MDA-MB-231 cells to growth in soft agar in the presence/absence of ZOL was assessed using anchorage-independent colony-formation assay. Subconfluent breast cancer cells were plated (10,000 cells/well) in triplicate in 6 well plates for anchorage-independent soft agar assay as previously described (49). Cells were cultured in the absence or in the presence of different concentrations of ZOL (5, 10, 15 and 25 μM) for around 8 days at 37°C and 5%CO2. Colonies were counted using the colony counter machine. Data are representative from three independent experiments. C). ZOL induces cells death in cells overexpressing CCN1. The effect of different concentrations of ZOL on MDA-MB-231 and MCF-7/CCN1 compared with MCF-7/pBabe (empty vector) cells were observed in 2D culture and photographed in an inverted microscope. D). ZOL induces apoptosis in MDA-MB-231 cells in a dose dependent manner. The cell death induced by ZOL in MDA-MB-231 cells was assessed by Annexin V. Briefly, MDA-MB-231 cells were treated with different concentrations of ZOL (10, 15, 25, 50 and 100μM) for 48h. Then cells were harvested and stained for Annexin V following the instructions of the kit. After staining, cells were analyzed by FACScalibur flow cytometry. Cell Quest software was run for data acquisition and Modfit software for analysis. Data are shown as mean ± SEM of 3 independent experiments. *P< 0.05 from control cells. **P <0.01 from control cells.


