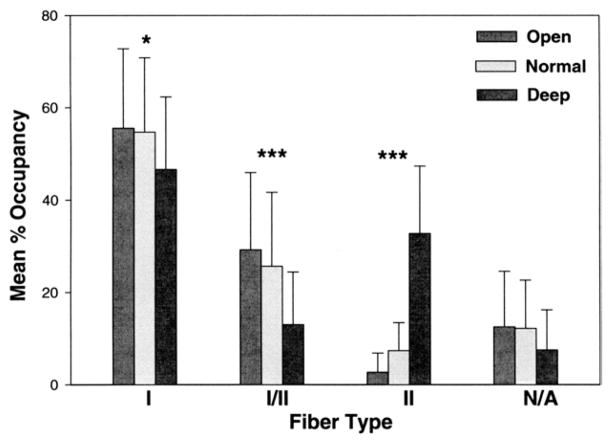
FIGURE 3.
Comparison of mean percent occupancies of fiber types in male and female subjects by vertical skeletal malocclusion group. Data for overall muscle tissue percent composition of each fiber type for skeletal open bite (14 males and 36 females), normal vertical dimension (16 males and 42 females), and deep-bite mal-occlusion categories (16 males and 15 females). Bars represent 1 standard deviation of the mean. Significant differences were found for type I percent occupancy (*P = .043), and very significant differences for type I/II hybrid and type II fiber percent occupancy (***P ≤ .0004).
Sciote et al. Human Masseter Muscle Fiber Type Properties. J Oral Maxillofac Surg 2012.

