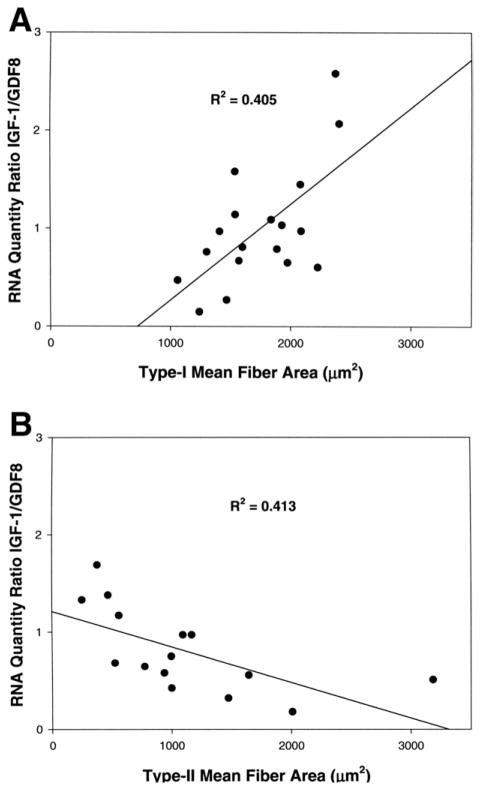
FIGURE 5.
Linear regression analyses of relative quantities of IGF-1 and GDF-8 RNA with type I and type II mean fiber areas. A, Plot of the ratio of relative quantities of RNA for IGF-I to GDF-8 growth factor ratios and type I mean fiber area values for 18 female masseter muscles. B, Plot of the ratio of relative quantities of RNA for IGF-I to GDF-growth factor ratios and type II mean fiber area values from 15 male masseter muscles. R2 values represent the correlation coefficient of each plot.
Sciote et al. Human Masseter Muscle Fiber Type Properties. J Oral Maxillofac Surg 2012.

