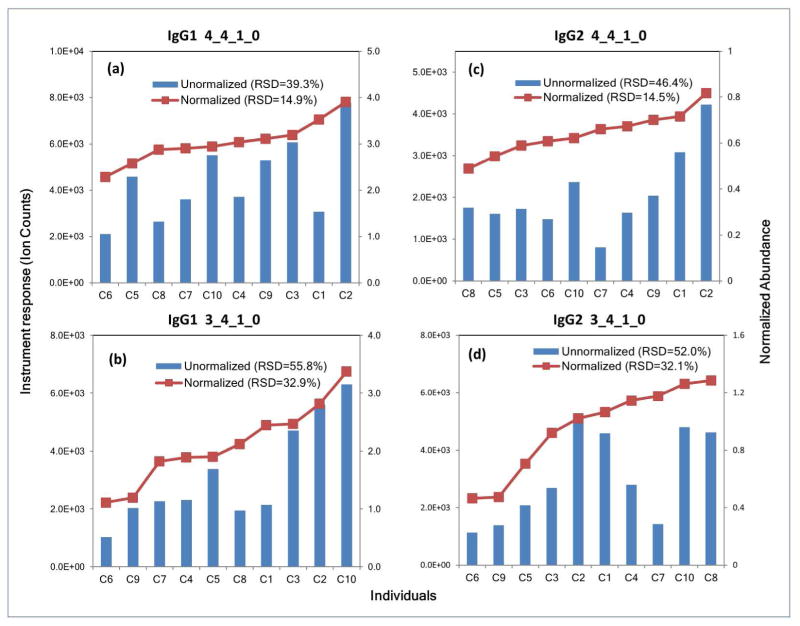
Figure 4.
Normalized (red squares) and unnormalized (blue bars) glycopeptide abundances of 4 IgG glycopeptides monitored in the sera of individuals. Normalization was performed using equation 2. (a) IgG1 glycopeptide, Hex4HexNAc4Fuc1-EEQYNSTYR (b) IgG1 glycopeptide, Hex3HexNAc4Fuc1-EEQYNSTYR (c) IgG2 glycopeptide, Hex4HexNAc4Fuc1-EEQFNSTFR (d) IgG2 glycopeptide, Hex3HexNAc4Fuc1-EEQFNSTFR. For each glycoform, the normalized trends in abundances do not directly match the unnormalized ones.

