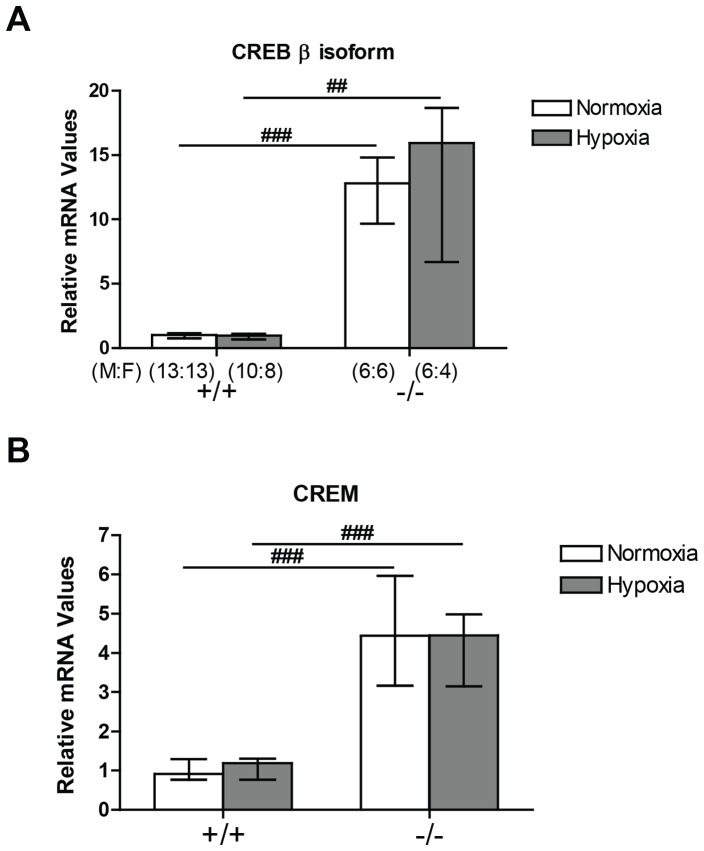
Figure 1. CREB β and CREM mRNA expression in the mouse lung by quantitative real-time PCR.
Expression level is shown as median ± interquartile range. (A) CREB β was significantly elevated in the CREBαΔ mouse lung compared to wild-type mice in normoxia and in hypoxia. (B) CREBβ was significantly elevated in the CREBαΔ mouse lung compared to wild-type mice in normoxia and in hypoxia. Number of male and female mice (M:F) in each of the four groups is shown in panel A and is identical in panel B. ## and ### indicate significant difference from corresponding wild-type mice group (P<0.01 and P<0.001, respectively).

