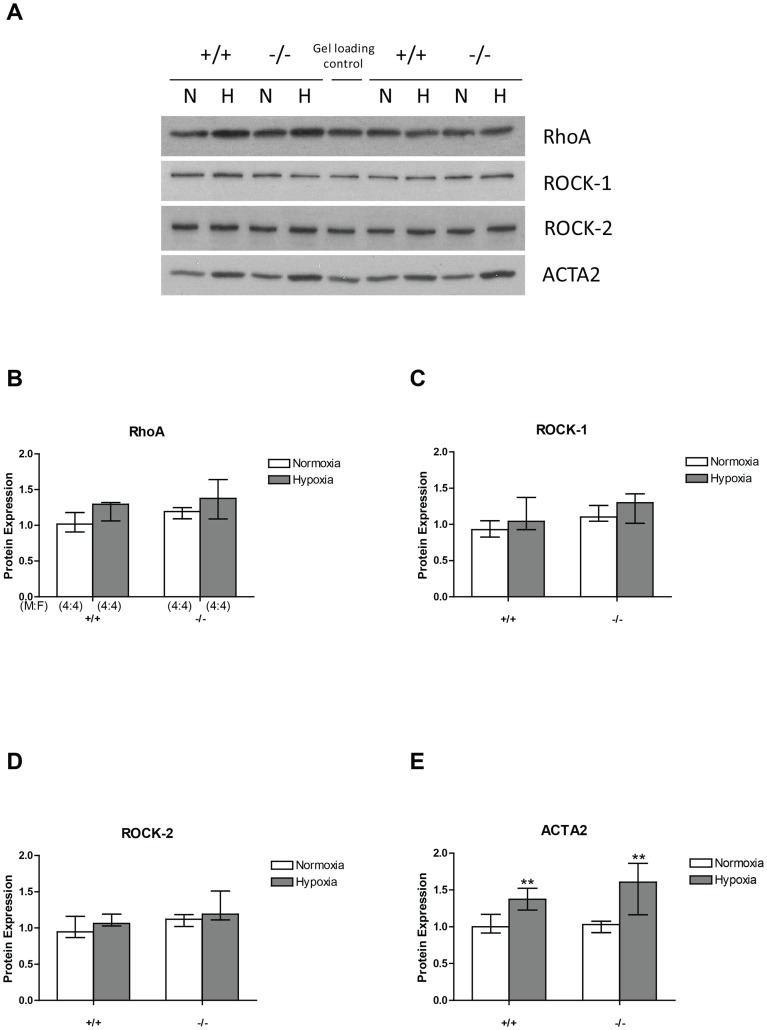
Figure 6. RhoA, ROCK1 and ROCK2, and ACTA2 protein in the mouse lung by western blotting.
(A) Representative images of western blots of RhoA, ROCK1, ROCK2, and ACTA2 protein expression under normoxic and hypoxic conditions in wild-type and CREBαΔ mice. Panels B, C, D and E show values of optical density analysis of images of western blots examining RhoA, ROCK–1, ROCK–2 and ACTA2 expression in normoxic and hypoxic lungs of both genotypes. Values are expressed as median (± interquartile range) relative to the mean normoxic value in wild type lungs. (B) RhoA expression (C) ROCK–1 expression (D) ROCK–2 expression and (E) ACTA2 expression in the lungs of wild-type and CREBαΔ mice under normoxic and hypoxic conditions. Number of male and female mice (M:F) in each of the four groups is shown in panel B and is identical for panel C, D, and E.

