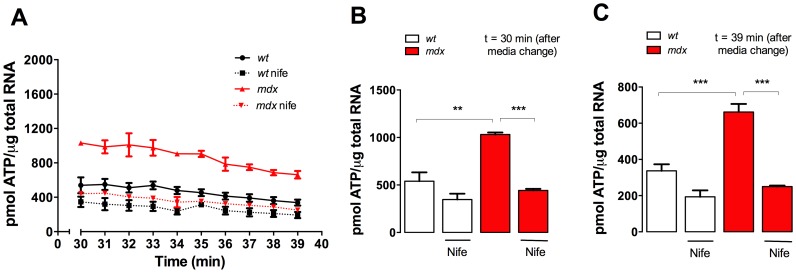
Figure 4. Extracellular ATP concentration in FDB fibers isolated from either nifedipine- or saline-treated wt and mdx mice.
A. Time course of extracellular ATP levels after media change. ATP concentration was measured with CellTiter-Glo® Luminescent Cell Viability Assay. Average extracellular ATP at 30 min (B) and at 39 min (C) after media change are shown in the figure. Data are expressed as mean ± S.E.M. FDB fibers were cultured from n = mice are indicated in the figure. **P<0.01, ***P<0.001, ANOVA-Tukey’s.

