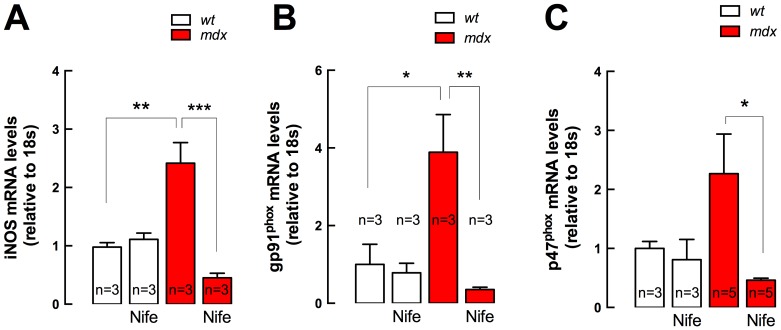
Figure 6. iNOS and NADPH oxidase subunits gene expression in diaphragm muscles.
Diaphragms were dissected from nifedipine- and saline-treated mice and mRNA levels were assessed by real time PCR. A. iNOS, B., gp91phox and C. p47phox expression. Data are expressed as mean ± S.E.M. Diaphragms were obtained from n = mice as indicated in the figure. *P<0.05, **P<0.01, ***P<0.001, ANOVA-Tukey’s.

