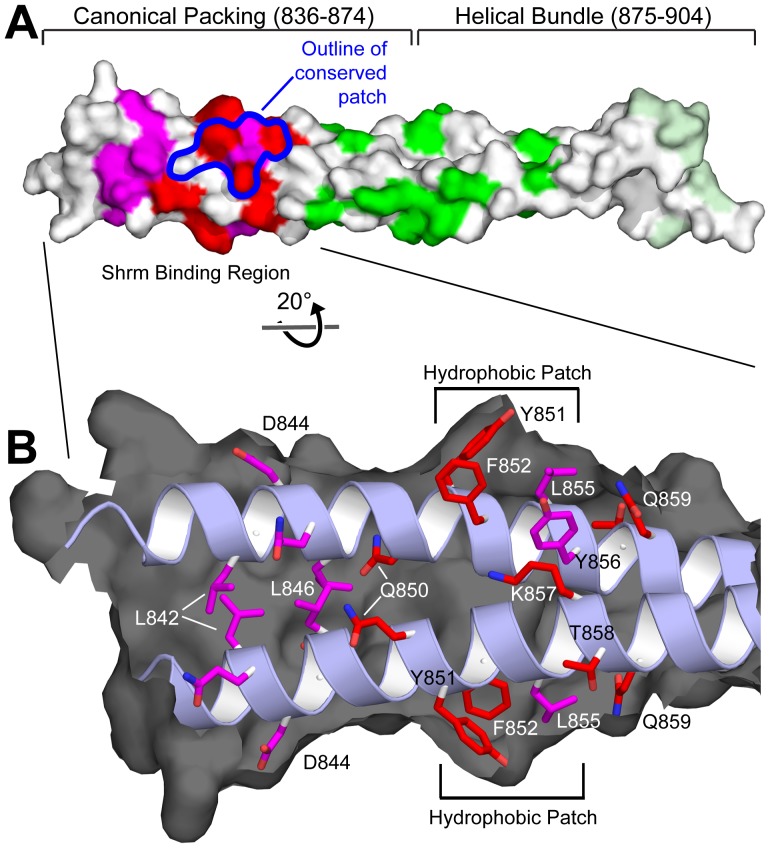
Figure 7. Opposing Shrm binding sites within the SBD.
A) Surface representation of the Rock SBD colored by the effect of substitutions in cell based and in vitro assays. Included are positions which altered Shrm colocalization (magenta), positions which affected SD2 binding in vitro (red), residues which did not affect SD2 binding in vitro (green), and residues 900–902 which had a subtle affect on SD2 binding (pale green). B) Cutaway view of the Shrm binding region. Ribbon diagram and positions of side chains with a demonstrated affect (sticks) are colored as above. Black represents the Rock surface which has been cut away to reveal the backbone and side chains underneath. A hydrophobic patch comprised of residues Y851, F852, and L855 is indicated for each binding site.

